I love Bitcoin. Nothing would make me happier than to see one of Plan B's optimistic stock-to-flow (S2F/STF) models become an accurate predictor of Bitcoin's price.
Up until now, there has been a non-spurious relationship between stock-to-flow and bitcoin's price. That's one reason it's such a compelling narrative.
I hope I'm wrong, but inevitably, BTC's stock-to-flow models will diverge dramatically from their predicted trendline. This article doesn't distinguish between the original S2F model and the latest S2FX model since they share a similar concept.
I am writing this while the world is counting down the hours to Bitcoin's third halving, which will occur on May 12, 2020. BTC costs nearly $9,000.
EDIT/UPDATE: Jump to my annual updates, where I reflect on how bitcoin's price has performed since writing this article, and I look ahead to 2024 and beyond. This article remains worth reading and relevant because the eight flaws still exist in Plan B's stock-to-flow model.
What is the hypothesis of Bitcoin's stock-to-flow model?
Like gold, Bitcoin has a relatively large existing stock compared to the annual flow of new Bitcoin mined.
Gold, unlike most metals, sees its total stock increase relatively slowly compared to its existing stockpile. We have 200,000 tons of gold (the stock), and we mine about 3,000 tons of new gold annually. In other words, gold's flow adds about 1-2.5% to its annual stock.
That results in a stock-to-flow ratio of roughly 65. That means that if we halted gold mining today, it would take us 65 years to consume the existing stock. I've seen lower and higher S2F estimates, so let's assume that 65 is close enough.
Gold's stock-to-flow ratio is significantly higher than that of any other metal, partly explaining its exceptional value.
Bitcoin is similar to gold in that it also has a high stock-to-flow ratio. The amount of newly mined bitcoins is tiny when compared to the existing stock of bitcoins.
Therefore, the hypothesis is that as bitcoin's stock-to-flow ratio rises, so will its price.
So far, that's precisely what has happened up until the 2020 Halving. Will the pattern continue?
The stock-to-flow narrative is so compelling that it has become a viral hit among Bitcoin fans.
I certainly bought into it enthusiastically.
Stock-to-flow models make many Bitcoin price predictions
The original stock-to-flow model predicted that BTC would reach $55,000 in 2021. That's about a 6-fold increase in 18 months.
On April 27, 2020, Plan B presented his BTC S2F Cross Asset (S2FX) Model. The S2FX predicts that by 2024, BTC will be worth an eye-popping $288,000.
This sounds too good to be true.
This article explains why both stock-to-flow models will soon fail.
Since most people reading this don't know me, here are a few facts about me, in case you're wondering, "Who the hell is this asshole?":
- I'm not a newbie. I first bought BTC when it was $250. (My brother bought 10 BTC when it was $1 each, and then got hacked and lost it all.)
- I accurately predicted BTC's 80% price drop in 2018.
- I nailed my 2019 prediction within $33.
- I'm a Harvard MBA, so I like to pretend to know what I'm talking about.
8 problems with Plan B's stock-to-flow bitcoin models
For those who dislike reading, watch this video (skip to 4:15 if you're already familiar with the stock-to-flow model):
The list below is arranged from the least significant to the most significant problem.
Problem #8: Not everyone agrees on what gold's stock-to-flow ratio is.
Although most quants agree that gold's stock-to-flow ratio is in the 60s, a few believe it's much higher. For example, Philip Barton, a gold analyst, argues that gold's stock-to-flow is between 400 and 800!
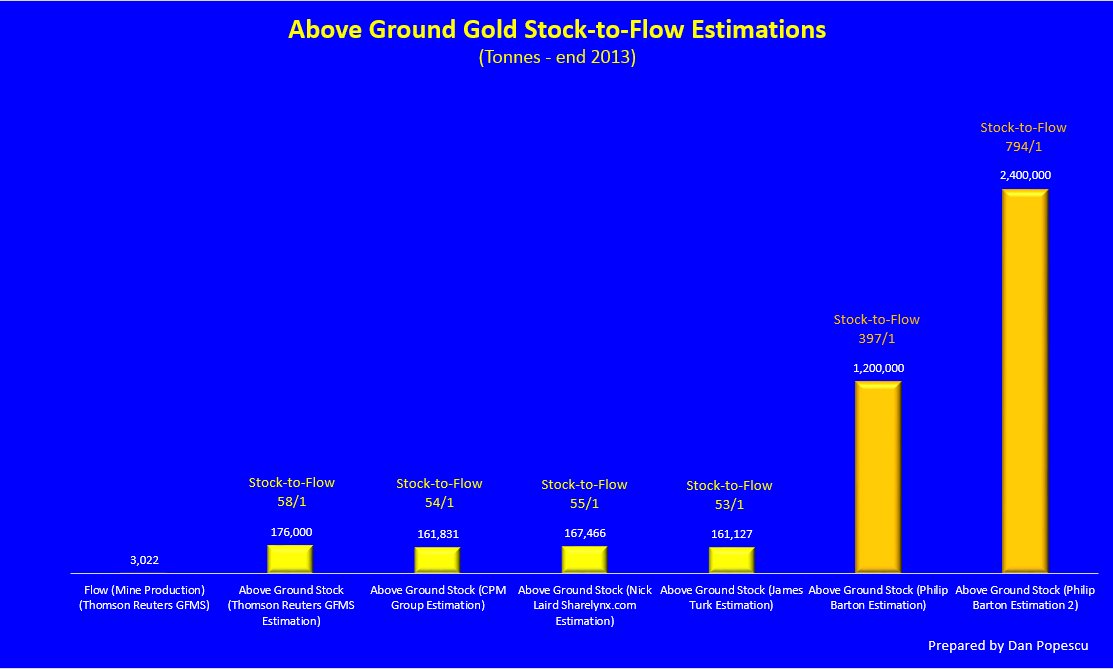
Admittedly, Barton is an outlier. The consensus is that gold's stock-to-flow ranges between 50 and 70. Still, it's worth noting that some believe there is far more stock out there than we realize. How could gold's stock-to-flow ratio be 800?
The main reasoning is that when humans first started collecting gold, there was much low-hanging fruit. Enormous gold nuggets were easily accessible in the streams and other sources. It's reasonable to assume that gold nuggets simply sat in the streams for millions of years since no animal valued them.
When humans began collecting gold, the global gold stock must have soared exponentially. Its curve must have looked like the first decade of Bitcoin's supply curve.

That's why Barton and others believe that gold's stock-to-flow ratio is 10 times higher than what most people think it is.
If that's true, Bitcoin's stock-to-flow model is somewhat inaccurate since it predicts that Bitcoin will exceed gold's stock-to-flow ratio by 2025.

This problem is the least of all of the issues with Bitcoin's stock-to-flow narrative. It gets worse.
Problem #7: Gold's stock-to-flow isn't fixed
Plan B presents timelines that show bitcoin's ever-rising stock-to-flow ratio. He depicts gold (and silver) as a single data point in those charts as if their stock-to-flow ratios are constant.
For example, in Plan B's chart below, you can see how the stock-to-flow ratio of Bitcoin has increased over the past 10 years. Meanwhile, on that chart, Plan B depicts gold stock-to-flow (SF) fixed at 62 and silver's SF at 22.
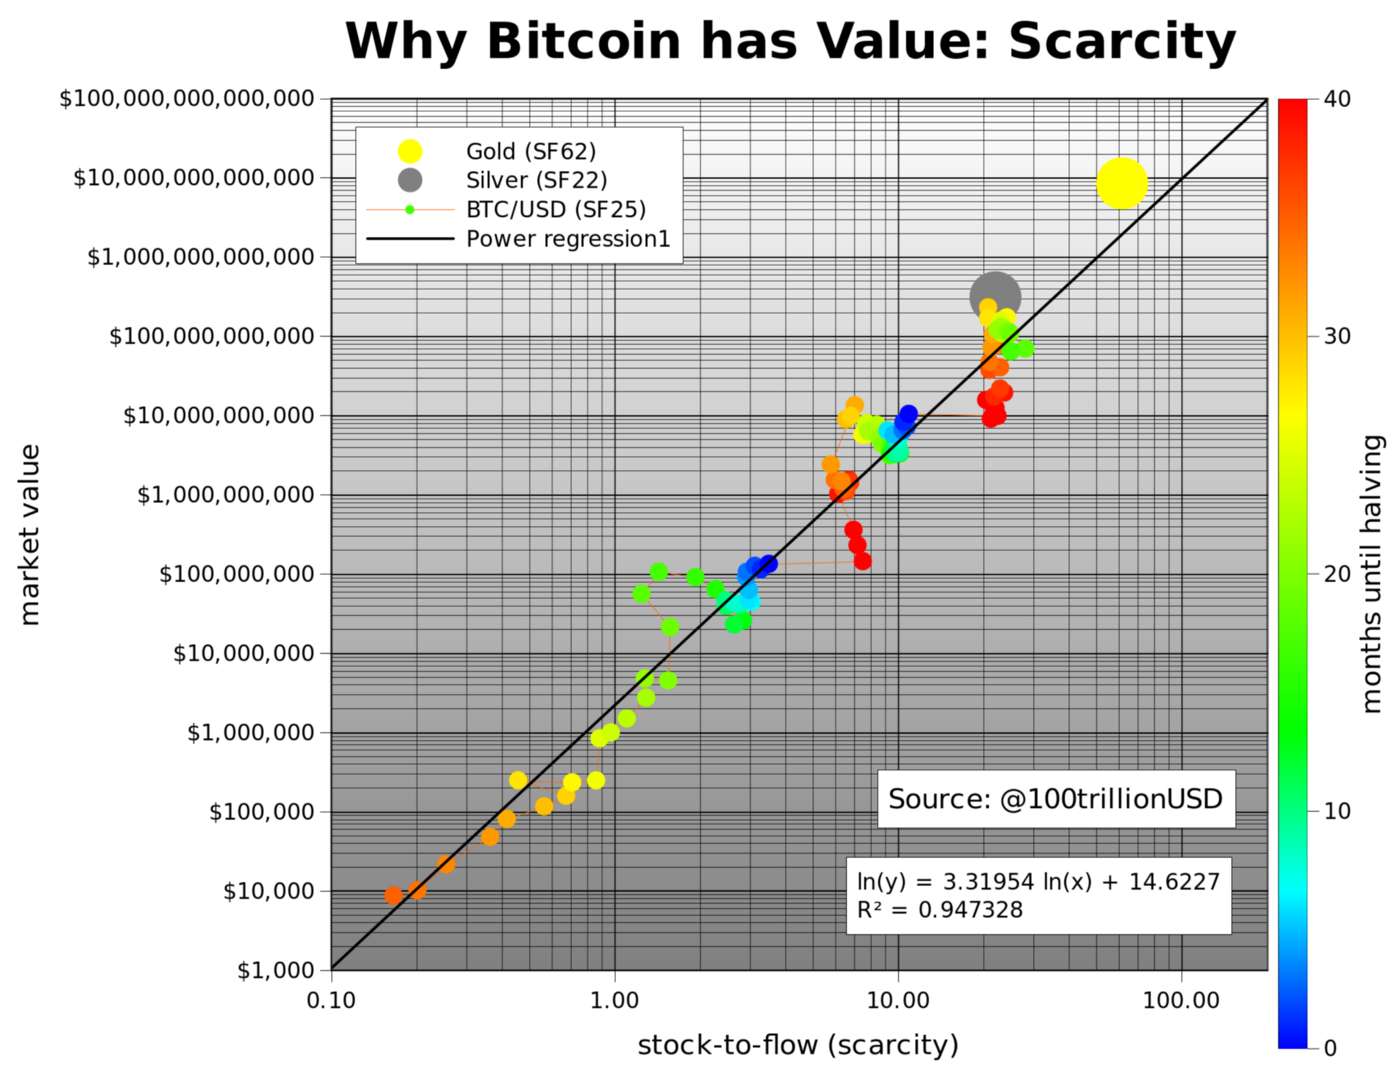
Bitcoin's stock-to-flow model gives you the impression that gold's stock-to-flow is nearly constant.
The reality is that gold's stock-to-flow ratio is constantly fluctuating.
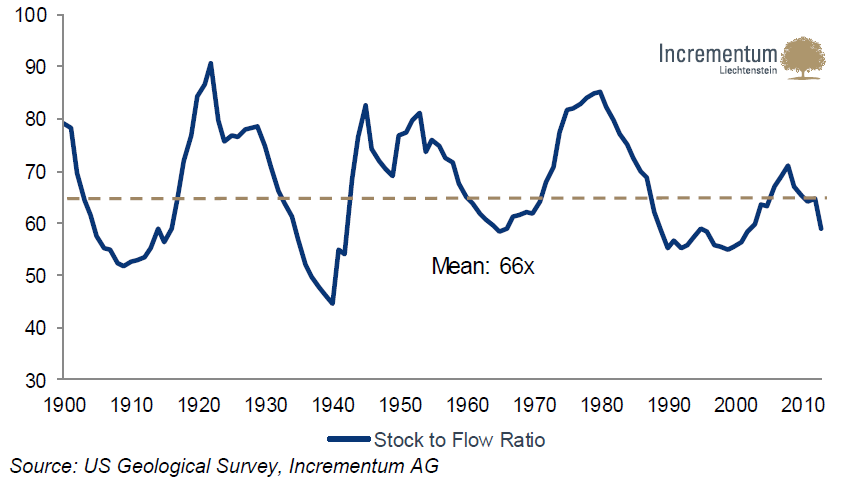
Here's a chart that shows gold's average stock-to-flow ratio is 66, but it has had a wide range over the last 120 years.
Gold's stock-to-flow ratio has ranged from as low as 45 in 1940 to as high as 90 in 1920. Gold has bounced around those extremes.
Problem #6: Gold's stock-to-flow does not drive its price
Plan B observed that because Bitcoin's mining flow halves every four years, Bitcoin's stock-to-flow ratio leaps every 4 years. These halving events significantly boost Bitcoin's stock-to-flow ratio. It's reasonable to assume that the contracting supply is fueling the BTC's dramatic price rise.
Intuitively, the stock-to-flow model makes sense once you conduct a simple thought experiment. Imagine if the flow of gold suddenly slowed to a trickle. Instead of 3,000 tons of gold being mined annually, we only managed to dig 3 tons of gold each year.
What do you predict would happen to gold's price?
It would skyrocket, right?
That's because investors, national banks, jewelry makers, phone makers (0.034 grams of gold in each phone), and other industries that use gold would have to fight over a (nearly) fixed supply.
Still, if the stock-to-flow ratio were such a great price predictor, then we should see gold analysts use it all the time.
But they don't. Gold bugs only cite gold's stock-to-flow to help explain why gold has monetary value. But they don't use it to predict gold's price.
That's because, as you can see from Voima's chart below, gold's stock-to-flow ratio is sometimes uncorrelated with gold's price.
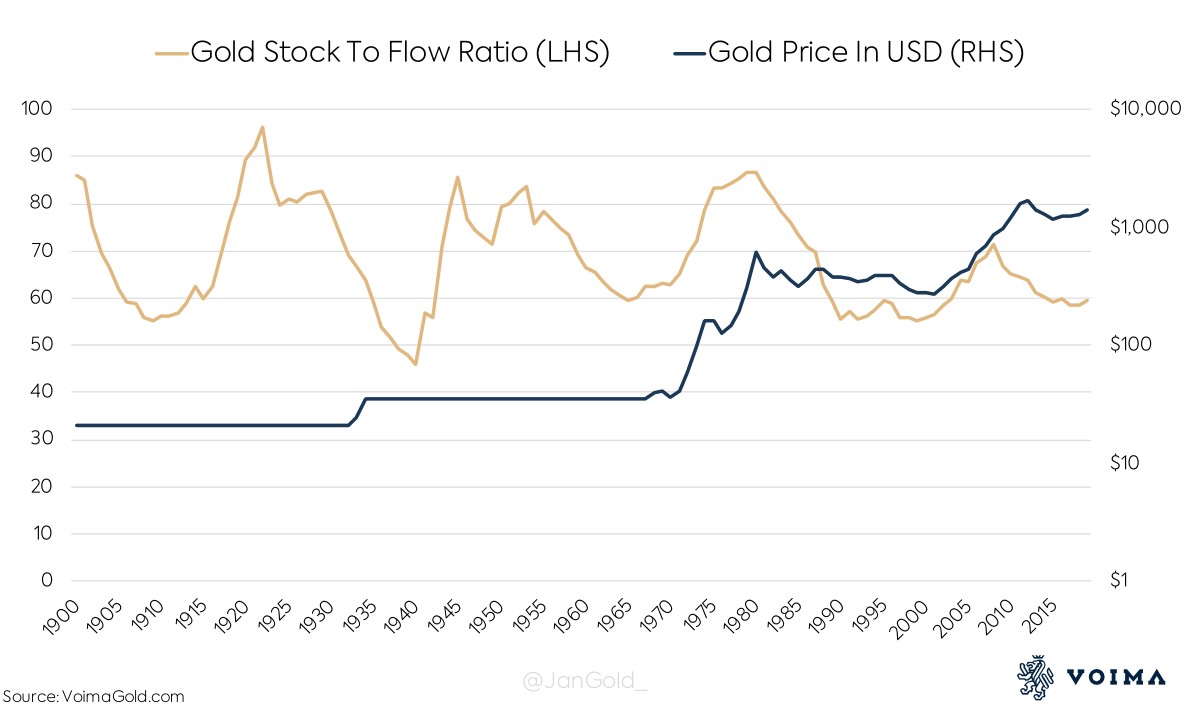
The above chart is somewhat misleading because it only displays the nominal price of gold, which, before 1971, was fixed by the government.
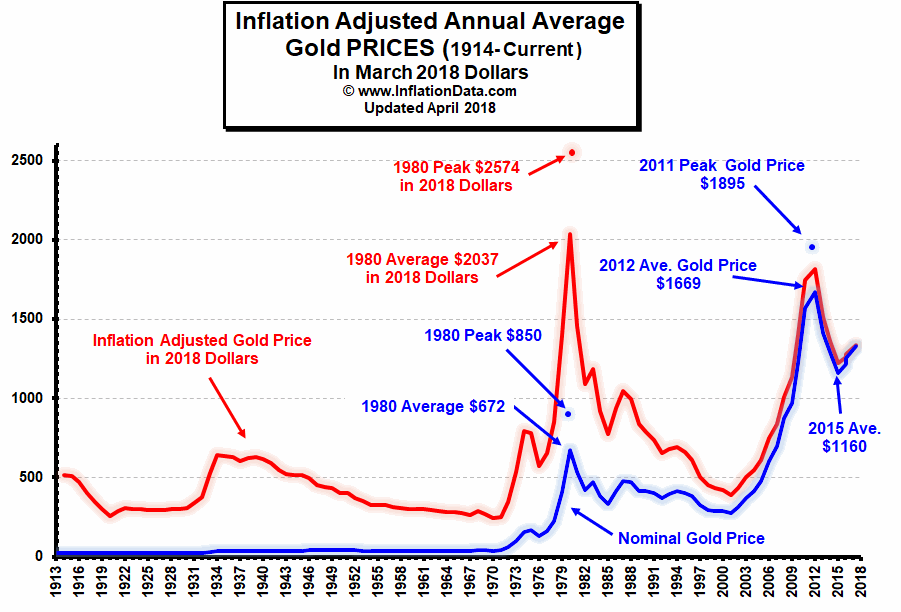
Below is the real, inflation-adjusted price of gold. When examining the red line, overlay the cyclical stock-to-flow line on top of it. You'll see no correlation.
For example, in the graph above, you can see that the STF (the gold line) hit a high of 95 around 1920. But the graph below shows that the inflation-adjusted price (the red line) is relatively low in the 1920s. You'll see the opposite when you compare the 1940 numbers.
In short, gold's price is uncorrelated with its stock-to-flow ratio.
I haven't read a single gold expert argue that stock-to-flow drives gold's price. As proof, at the bottom of this article, you can watch my interview with Jan Nieuwenhuijs, a famous gold researcher and analyst.
However, according to the S2F model, the alleged driver of bitcoin's price rise is its ever-increasing stock-to-flow ratio. As the stock-to-flow ratio of Bitcoin increases, its price follows. That is the thesis.
That implies that if Bitcoin's stock-to-flow ratio ever stabilizes, then its price should stabilize as well.
Gold's stock-to-flow and price history tell a different story. Over the last 120 years, gold's STF ratio has cycled up and down while gold's inflation-adjusted price has gone all over the place.
Problem #5: Some metals with extremely low stock-to-flow ratios are worth more than gold
In the chart below, Plan B noted the stock-to-flow of other metals besides gold and silver:
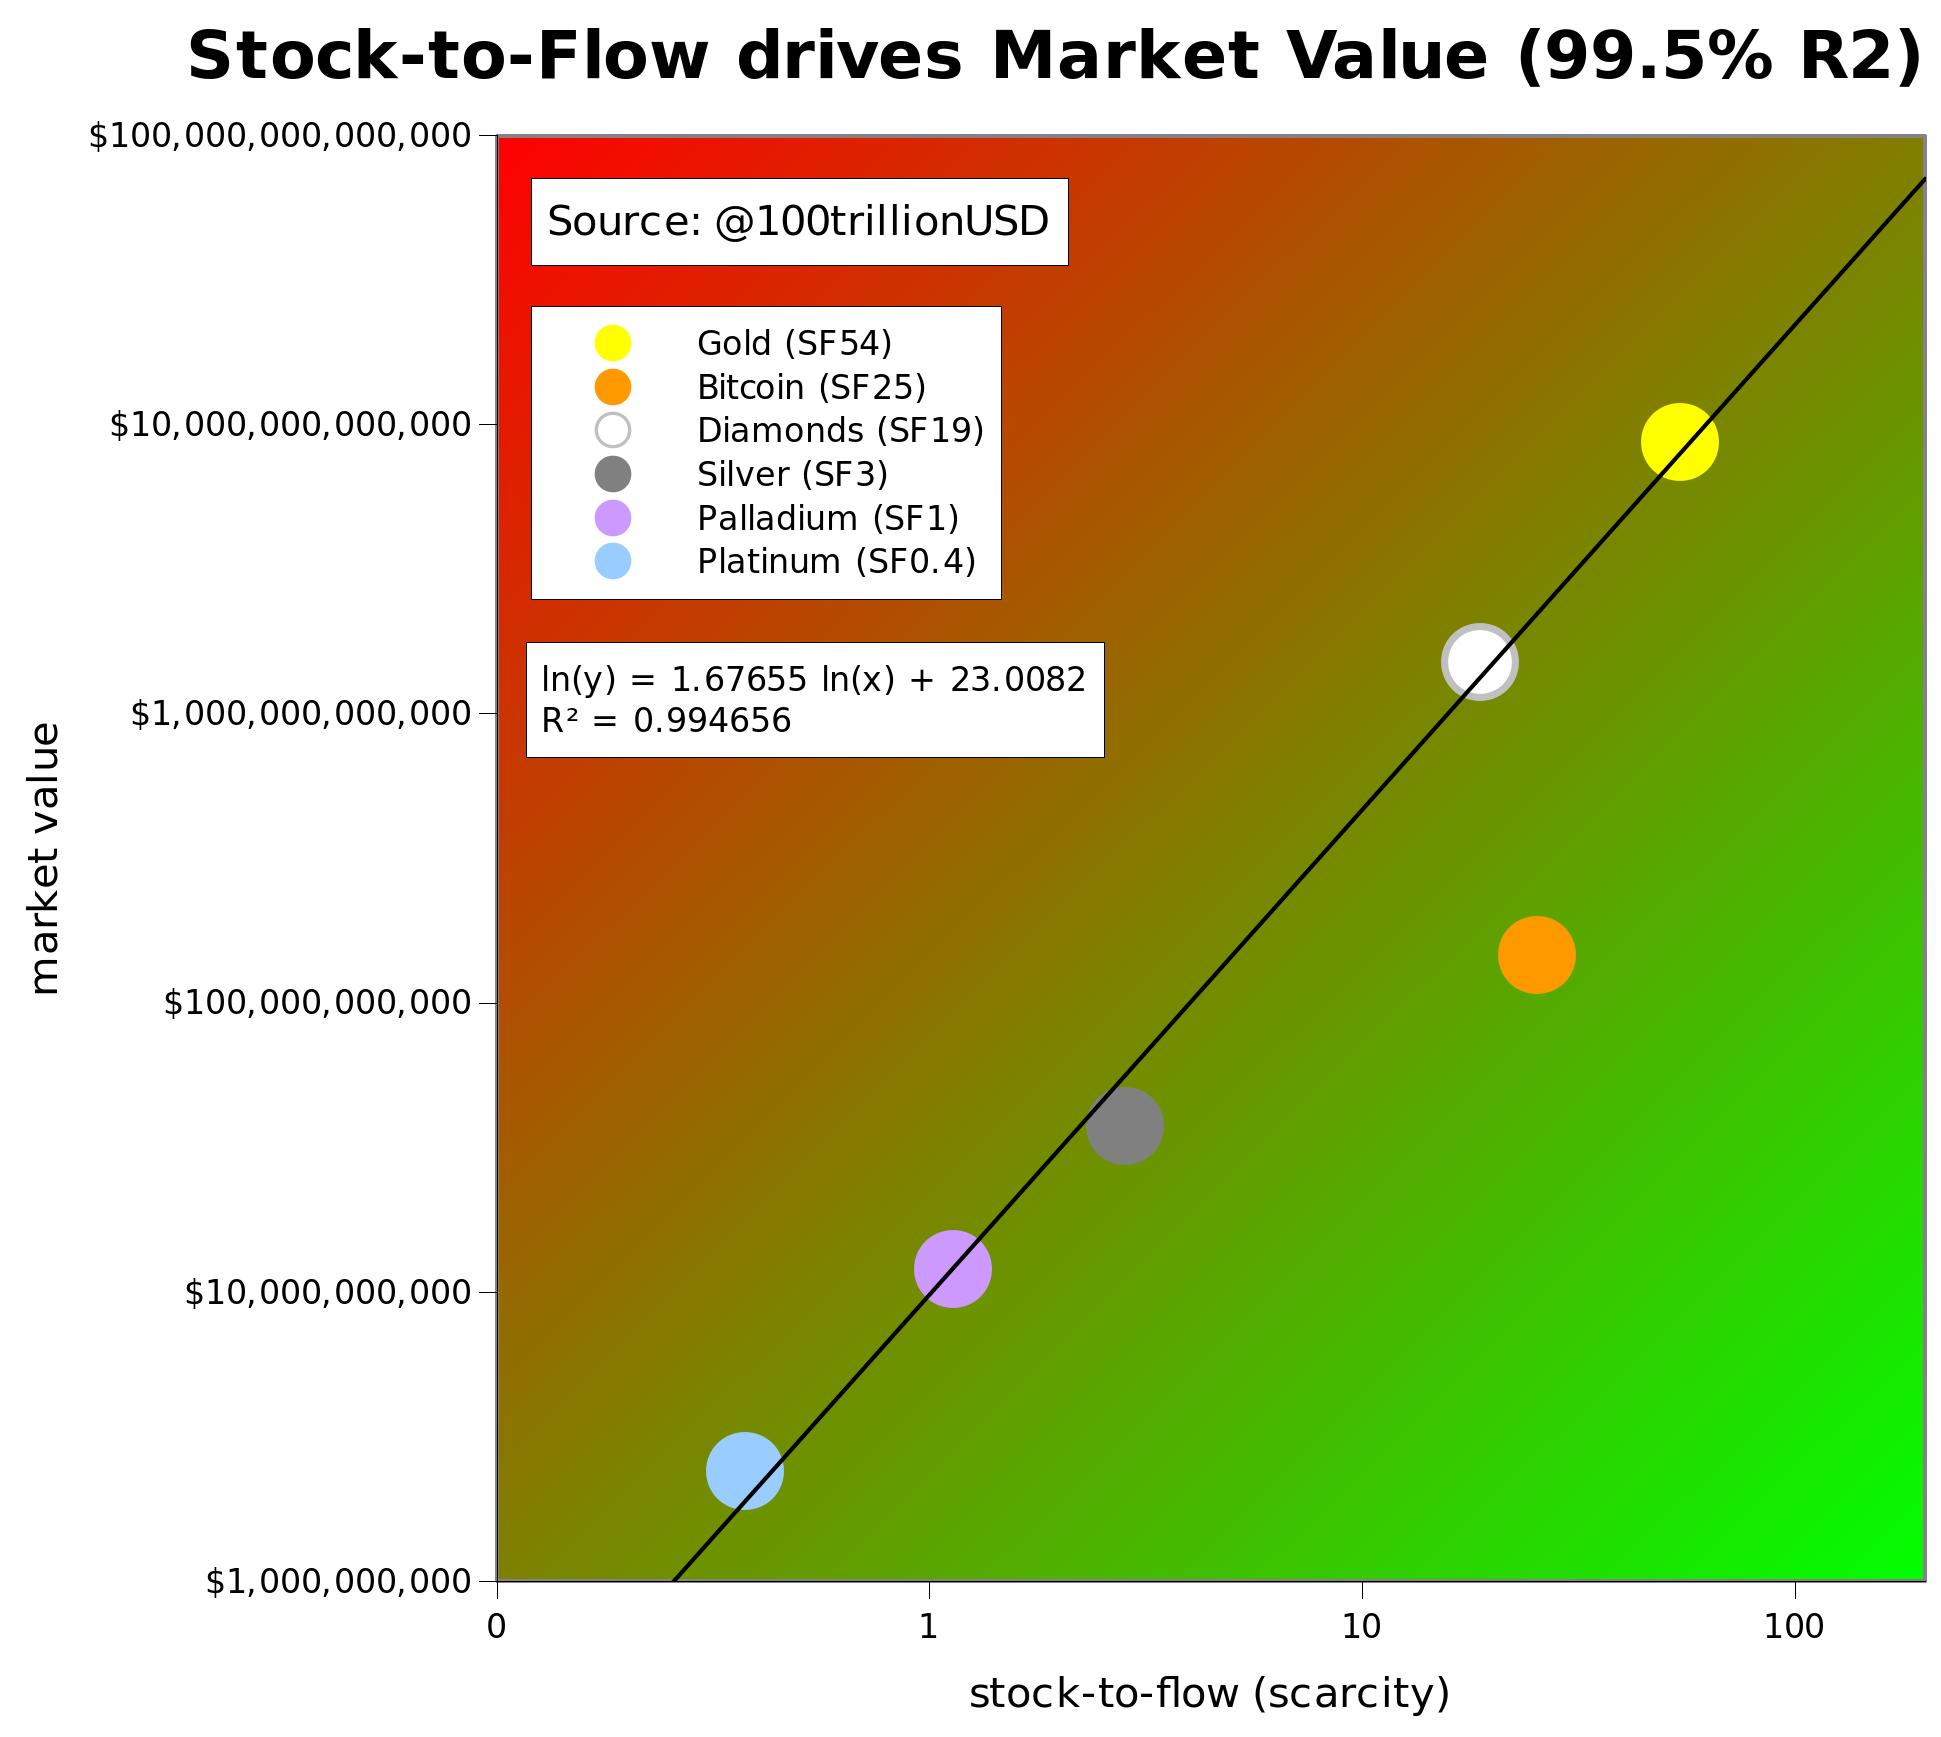
According to one estimate, platinum has a measly stock-to-flow ratio of 1.1.
This surprised me because, in Dungeons & Dragons, one platinum piece is worth 10 gold pieces (back when I played, the roleplaying game used a 5:1 ratio). It is truly soul-crushing that D&D doesn't reflect reality.
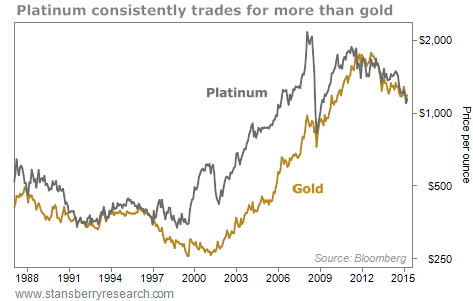
In the real world, the price difference isn't that big. Still, ounce for ounce, platinum usually costs more than gold.
It's the same story with palladium.
Palladium has a paltry stock-to-flow ratio of 0.4.
However, you wouldn't guess that after comparing its price to gold and platinum.
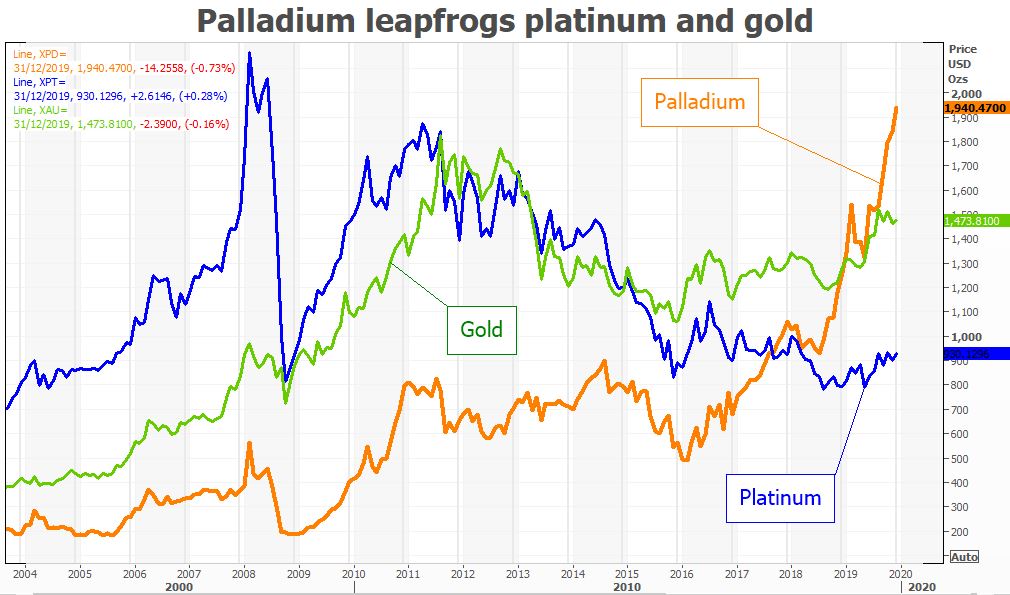
Therefore, there's a disconnect between stock-to-flow and price in the world of precious metals.
That's why metal quants and forecasters hardly mention stock-to-flow when making price predictions.
Some may argue that palladium and platinum are commodities, whereas gold's high stock-to-flow ratio places it in a distinct category: a monetary metal.
True, but it raises some concerns about how tightly we should link stock-to-flow to the price.
Stock-to-flow is important, but it's not the primary driver behind the price of metals.
It's just one of many important factors.
Problem #4: STF doesn't explain the prices of other cryptocurrencies
Not only does stock-to-flow fail to explain why palladium and platinum are often worth more than gold despite having tiny stock-to-flow ratios, but S2F also fails to explain the value of other cryptocurrencies.
In the vast universe of shitcoins, some have a stock-to-flow ratio that is significantly higher than that of bitcoin and gold. If not, we could invent one tomorrow. But that wouldn't make it valuable.
Jan Nieuwenhuijs makes exactly that point in my interview with him (see it below). He suggests that we could create a cryptocurrency that halves every day, rather than every four years. We could engineer one that has a stock-to-flow of 50,000. However, unless there's demand, that cryptocurrency would be worthless.
Problem #3: STF assumes that bitcoin's demand continues to grow exponentially
The Achilles' heel of Bitcoin's stock-to-flow model is that it only considers supply.
Economics 101 teaches you that the price of anything is driven by supply and demand. If you only know the supply, you cannot predict the price.
Jan Nieuwenhuijs is a gold guru who, like Plan B, is a Dutchman. Jan said, "If there is no demand for something, the value is zero."
In other words, Bitcoin's tightening supply is only half the story.
Since its inception, Bitcoin has enjoyed robust and growing demand. Indeed, Bitcoin's demand has typically outstripped its supply, which explains why its value has been rising despite a double-digit inflation rate throughout the 2010s.
The stock-to-flow model will be accurate, provided that the demand continues to grow exponentially as it has for the last 10 years.
However, as Facebook is discovering, there are fewer than 8 billion potential customers on this planet. Bitcoin will ultimately reach market saturation.
But long before that, it will run into a much more serious barrier...
Problem #2: STF underestimates the powers that be
The stock-to-flow model underestimates the challenge of maintaining the same exponential growth as your size increases.
When Bitcoin's market cap went from $1 million to $100 million, the world hardly noticed or cared.
Going from a $100 billion market cap to a $10 trillion market cap is also 100 times growth, but it is orders of magnitude more difficult to achieve.
That's because if Bitcoin has a $10 trillion market cap, it's no longer a fly in the room. It's the elephant in the room. That would make bitcoin's market equal to the 3,000-year-old gold market!
In the What Bitcoin Did podcast, Plan B told the host Peter McCormack that bitcoin "is not a toy anymore."
True. When it was a "toy" in the 2010s, the power players kept a wary eye on it, but they hoped it would stay small or disappear.
If Bitcoin manages to grow into the next phase transition, it will step on many toes with sharp claws. Bitcoin will disrupt industries, but not without a fight. Bitcoin will survive, but it will suffer setbacks and slower growth as a result.
In the next phase transition, Bitcoin will begin to bump its elbows against many entrenched powers: regulators, governments, banks, tax authorities, Western Union, financial services, environmentalists, gold bugs, the FBI, the CIA, and grumpy old baby boomers.
If Bitcoin threatens them, they will do whatever it takes to stop Bitcoin and preserve the status quo.
Bitcoin enthusiasts often underestimate the power of these entities. Although these powerful organizations cannot destroy Bitcoin, they can slow down its adoption (i.e., demand). They will erect troublesome roadblocks. They will impede (and perhaps stop) bitcoin's ability to continue rising to the next "phase transition."
It's naive to underestimate these future challenges, but the stock-to-flow model ignores them.
To be realistic, the stock-to-flow model ought to have some "deceleration factor" in the calculation. That's because each "phase transition" becomes progressively more challenging to achieve.
Bitcoin's market cap curve will likely resemble Murad Mahmudov's chart below, where BTC's exponential growth rate slows as its market cap increases.

Problem #1: S2F defies physics
Some critics argue that the stock-to-flow model will break in 2140 when we cannot mine new bitcoins. At that point, the S2F model predicts that the price of Bitcoin will approach infinity.
Although that is a problem, Bitcoin's stock-to-flow model is doomed to break at least 100 years before that date.
Bitcoin's stock-to-flow model predicts exponential growth into the foreseeable future. Such sprightly growth is necessary for Bitcoin to hit the $55,000 target in 2021 and its $288,000 target in 2024.
Bitcoin has already been the best-performing investment in the 2010s.
For the stock-to-flow model to continue working, Bitcoin will need to be the best-performing asset in every single decade in this century.
Pick any asset that has skyrocketed exponentially. It could be the stocks of technology companies, gold in the 1970s, or tulips in the past. Every single time, without fail, the asset's growth slows and never consistently recovers its initial surge.
It might occasionally have other growth spurts, but a sustained, nonstop rise never happens. However, the stock-to-flow model predicts dramatic exponential growth for several decades.
Eventually, exponential growth encounters negative feedback factors that counteract it.
According to digitalikNet's S2F projection, in 2050, one bitcoin will be worth more than $1 trillion!

Two things would have to happen for such a Panglossian scenario to occur:
- Bitcoin's price would have to double every year, on average, for the next 30 years. That's 30 doublings! No asset has ever come close to such a performance. Perhaps pre-IPO Microsoft, Google, or Walmart experienced such a rise over 10 years. But doublings become extremely difficult once an asset becomes large.
- We would need to invent nuclear fusion reactors and become a Type 1 Civilization. Bitcoin consumes vast amounts of energy. The higher the price goes, the more it consumes.
Unless Bitcoin solves its energy consumption problem, its growth will suffer. It doesn't matter if that environmental critique is correct or not. If the powers that be want to destroy Bitcoin, they can use Bitcoin's hungry energy consumption as an excuse to ban it or tax it prohibitively.
"Stop Bitcoin to stop global warming!" lobbyists will cry.
Overcoming that challenge will slow Bitcoin's growth.
The global economy is over $100 trillion. If one bitcoin were worth $1 trillion, just 10 bitcoins would be equal to 10% of the worldwide economy.
In 2050, there will be about 20 million bitcoins. Therefore, in 2050, if the stock-to-flow prediction is correct, then Bitcoin's market cap would be $1 trillion x 20 million coins = 20 x 1018
If we make the rosy assumption that the world economy grows 10-fold between 2020 and 2050, we will have a $1,000 trillion economy or a $1015 world economy.
Therefore, the bitcoin market cap would be 1,000 times more than the total global economy, which is impossible.
In short, the stock-to-flow model is doomed.
Bitcoin's ultimate brake: energy.
A couple of weeks after I wrote this article, I learned about an underappreciated and overlooked critique of the stock-to-flow model.
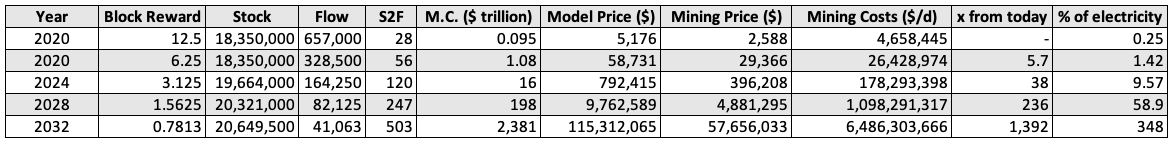
In it, the author, crypt∞li, estimates that for BTC to achieve its 2024 price target of $288,000, BTC would have to consume nearly 10% of the earth's energy (up from 0.25% in early 2020).
In 2028, it would devour nearly 60% of our energy.
And in 2032, we would need three Earths since it would consume 348% of our energy.
I mentioned that the S2F needs a "deceleration factor."
The aforementioned article agrees. Instead of assuming nonstop annual doublings, the author focuses on a reasonable rate of growth in energy consumption.
What's a level of growth that the world could adapt to?
Obviously, the world would never tolerate something going from consuming 0.25% of humanity's energy to 60% in just 8 years! And yet that's what the S2F model predicts!
Therefore, crypt∞li makes a far more reasonable (but still aggressive, in my opinion) assumption that the world could stomach BTC consuming an extra 0.5% of the Earth's energy every four years. The author writes:
It took Bitcoin’s network three cycles to claim 0.25% of the world’s electricity for mining, which is less than a 0.1% increase per cycle. In this scenario, the percentage increases 0.25% into the next cycle and another 0.5% per future cycle. Therefore, a total of 2% of the world’s electricity would be used for mining Bitcoin in 2032.
The set parameters and calculation approach would result in a Bitcoin spot price of roughly $1 million within the 2032–2036 cycle. In the upcoming cycle, a spot price of $32k can be estimated based on a ratio of 0.5% world’s electricity put towards mining.
I'd be thrilled if this "decelerated" S2F model were to come true. At least its estimates are not laughable like Plan B's model. However, they're still too optimistic, in my opinion.
It's hard to imagine that we'll use 2% of Earth's energy to mine BTC in 2032, but at least it's plausible. Plan B's energy forecasts are comical.
The S2F price prediction may be correct in a perfect storm
I want S2F to be right. I would be thrilled to be wrong. Let's try to imagine a scenario where it proves to be prescient.
Bitcoin may follow the next two stock-to-flow predictions if demand stays at a feverish pitch. For that to happen, we'll need the global economy to collapse, the dollar to devalue, governments to confiscate people's wealth, and widespread pandemonium.
Few humans own Bitcoin. And most who do, don't own much relative to their wealth.
If new buyers flood the market just as Bitcoin truly begins hardening its monetary policy, then that will create a perfect storm for Bitcoin to continue its improbable rise.
Hyperinflation will increase the dollar's nominal value, and we'll quickly reach the trillions.
Still, some might call that "cheating" since most models implicitly assume that the USD inflation rate will stay below 5% per year.
Imagine if a realtor estimates that your $500,000 home will be worth $50 billion in 10 years. You would laugh him off. But what if, thanks to hyperinflation, your home gets to be worth $50 trillion? Would you say that he was "right" even though the inflation-adjusted price is $1 million?
The stock-to-flow model ought to state its USD inflation assumptions. I believe it's fair to assume less than 5% inflation.
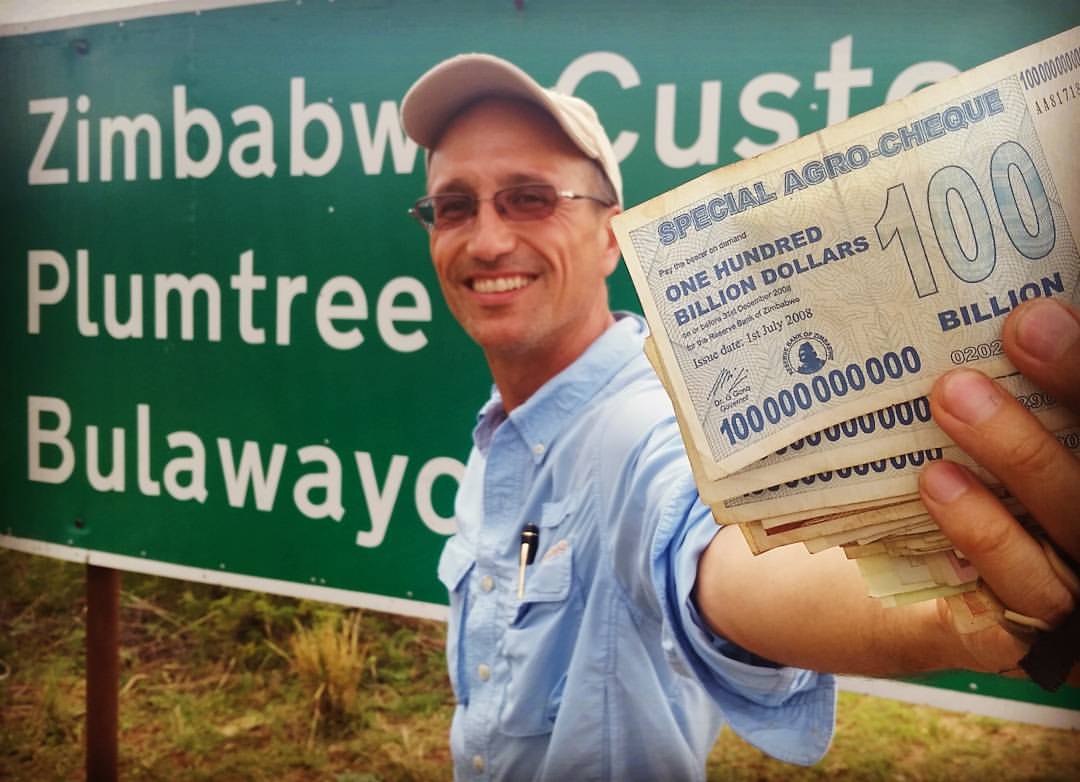
This reminds me of a few years ago, when I held a fat stack of $100 billion bills.
Lessons from the Rainbow Chart
Check out the whimsical but surprisingly accurate Bitcoin Rainbow Chart below.
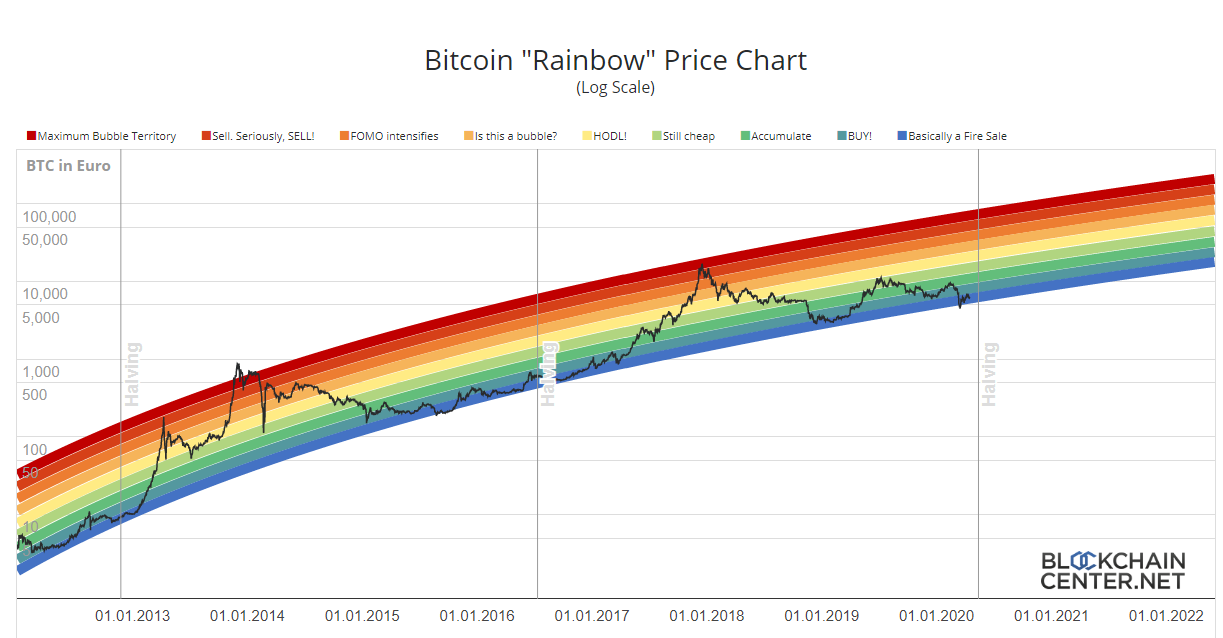
I love what its creator said about the Rainbow Chart:
"The color bands follow a logarithmic regression, but are otherwise completely arbitrary and without any scientific basis. In other words: It will only be correct until one day it isn’t anymore."
The same can be said of the stock-to-flow model.
Setting expectations about Bitcoin's stock-to-flow model
Plan B would probably say that I'm missing the point.
In the What Bitcoin Did podcast, Plan B told the host Peter McCormack that he "accepts that models will break." Plan B also recited two proverbs:
All models are wrong, but some are useful.
I'd rather be roughly right than exactly wrong.
Well said.
Furthermore, Plan B set modest expectations. He said, "I'd be happy if it would only forecast the next halving or the next two halvings correctly. That would be very useful."
True. What's also interesting is that he said on the Stephan Livera podcast: "If the model is successful, it will not be a pretty picture." That includes "the U.S. dollar losing its reserve status" and "maybe war."
His words suggest that the model cannot be successful without such "nasty" events. I agree that high-dollar inflation is the only way BTC will hit the dollar values that the S2F model predicts. If USD inflation stays below 5%, then the S2F is doomed.
IMO #bitcoin 2020 halving will be like 2012 & 2016. As per S2F model I expect 10x price (order of magnitude, not precise) 1-2 yrs after the halving. Halving will be make-or-break for S2F model. I hope this halving will teach us more about underlying fundamentals & network effects pic.twitter.com/kiTdN0n3Lu
— PlanB (@100trillionUSD) April 16, 2020
Plan B predicted that the "halving will be make-or-break" his stock-to-flow model.
I hope it will make it, but unfortunately, I believe it will break it.
I predict a 70% chance that Bitcoin's stock-to-flow model will break in 2021 and a 95% chance that it will break by 2024.
Each 4-year step (at the halving) gets progressively more difficult for the price to keep up. In 2025, if Bitcoin isn't worth $1 million, S2F is dead. The last big jump of this decade predicts that one bitcoin will be worth $50 million by 2029. Only hyperinflation will get us there.
Is there a better model than S2F?
Plan B challenges critics to devise a better model.
Developing a model that accurately predicts BTC's value years in the future is as challenging as accurately forecasting the S&P 500's value in five years. You would need to consider many variables. It's a bit like precisely predicting the weather five years in advance.
Therefore, what most quants do is forgo the accurate prediction and aim for a rough prediction instead.
The easiest way to do that is to use the previous performance and extend the trendline. In the case of the S&P 500, it has historically gained about 10% per year. That lets us project the S&P 500's value for the next 50 years.
That's effectively what the stock-to-flow model does. It takes past performance and projects it forward.
The problem is that it was modeled when Bitcoin was still in its infancy. That would be like creating a Dow Jones prediction model based on its first 10 years of existence. Or projecting a baby's height in 20 years based on his first 5 years of growth.
It might work if Bitcoin's first 10 years hadn't produced the best-performing asset of the decade.
To create a model that predicts that such returns will continue into the foreseeable future is utter folly.
And yet that's what the S2F model does. The stock-to-flow model predicts that BTC's ROI in the 2020s will be 684,831%! That's 142% per year!
No way.
The Limited Growth Smooth (LGS) Stock-to-Flow model
Two weeks after writing my article, I read QuantMario's LGS-S2F model. It noted a huge fallacy in the S2F model:
S2F assumes there is an unlimited amount of money in the world that can flow into Bitcoin.
After the fifth halving in about eight years from now, the original S2F model predicts the Bitcoin market capitalization to be higher than the value of all the property in the world: equities, real estate, fiat money, gold, etc.
Like me, QuantMario believes that the S2F model requires significant deceleration to be somewhat credible. He adjusted the formula to slow it down.
Here's how his LGS-S2F model differs from Plan B's model:

It's still extremely optimistic. He sums it up:
- The market cap of gold (around 10 $T) will be reached by 2035. This translates to almost half a million USD per bitcoin.
- The model predicts the market cap of Bitcoin to reach around $60–100 trillion, which puts each bitcoin at $2.8–4.8 million.

The best modified S2F model
We've looked at three S2F models:
- Plan B's original model and his S2FX model. Both are ridiculously optimistic and ignore the 8 flaws I mentioned.
- crypt∞li's S2F model derives BTC's price based on the assumption that BTC's percentage of worldwide electricity production must increase by less than 0.5% every four years. It's far more grounded in reality than Plan B's model, but it's still somewhat too optimistic. It's hard to believe that the world will let BTC consume 2% of the world's electricity by 2032. The world is already complaining loudly about Bitcoin's energy consumption, which uses 0.25% of the world's energy supply. Imagine the revolts when it's nearly 10 times more!
- QuantMario's LGS-S2F model decelerates bitcoin's price growth as its market cap increases. Its price targets are reasonable and defensible.
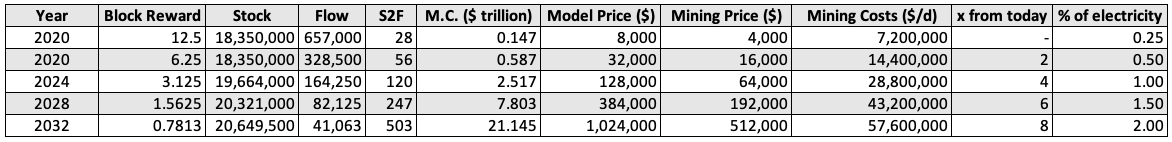
Finally, there's my favorite S2F model. It's in crypt∞li's excellent article that considers how miner adoption will help determine Bitcoin's long-term equilibrium.
Simply put, it concludes that as miners "transition from profitable mining via block rewards to profitable mining via regular transaction fees," bitcoin's price will rise at a more modest pace.
Notice in the table below that the electrical consumption remains below 1%. Although the price is not as thrilling as Plan B's, it's far more realistic.
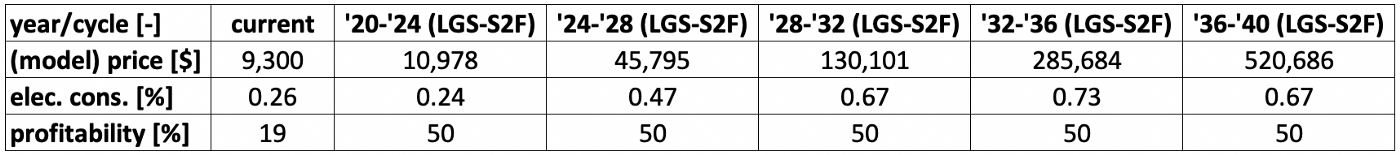
This price prediction is my favorite because it aligns with the one I made in 2019.
So, where will Bitcoin's price go?
I commend Plan B for offering a model to help understand Bitcoin's past and future. Whenever you criticize something, you ought to provide an alternative solution. So I will.
My prediction is even less scientific than the Rainbow Chart.
Beware of all price predictions, including mine, although I've been accurate in my annual predictions (but I've only had two).
I am sure that Bitcoin will continue to rise and baffle its many critics. It will march toward a $10 trillion market cap. It just won't do it as fast as the stock-to-flow model predicts.
On December 31, 2019, I predicted that bitcoin would end above $10,000 in 2020 and that there was a 30% chance that it would close above $20,000. I also predicted that it would reach $100,000 in this decade.
Such predictions make my friends chuckle and shake their heads in disbelief. They say I'm naively optimistic about this "imaginary money and Ponzi scheme."
Meanwhile, stock-to-flow fans laugh at my predictions for being too conservative. They believe that BTC will reach $100,000 by 2021 and $50 million by 2029.
Between those two predictions lies Tim Draper, who predicted that bitcoin would reach $250,000 by 2023.
I'm more conservative than many bitcoin fans because I expect entrenched powers to take off their gloves and pummel bitcoin. Its intense hunger for electricity will also cause it to slow down (perhaps because transaction costs will go up). Bitcoin will survive, but its growth will slow compared to the previous decade.
Therefore, that's why my unscientific estimate is $100,000 for the end of the 2020s. We'll trade above that range, but we close above $100,000. That would result in a 14x return in a decade, which would be pretty spectacular. Most assets would be happy with a 2-3x return in 10 years.
Beyond 2030
In the 2030s, it would be a triumph if BTC grew 5x. If my $100,000 prediction for 2030 is correct, it would mean that it would hit $500,000 in 2040.
With some further slowing, it could grow 2-3x in the 2040s. That would put it between $1 million and $1.5 million in 2050.
All my price predictions assume two things:
- The USD annual inflation rate stays below 5% (this is a generous assumption, as I believe the dollar will inflate dramatically between now and 2050).
- BTC's growth rate will gradually slow as its adoption (and energy consumption) increases.
I think it's rather fruitless to develop a model that predicts Bitcoin's long-term price, as the asset is too young and there are too many unknown variables in its future. At this point, all estimates are guesstimates at best.
Instead, just answer this question: In 20 years, do you think Bitcoin will be worth:
a) Nothing
b) Roughly the same amount as today
c) A lot more than today
I think (a) and (b) are doubtful. Therefore, it must be (c). For most people, such a rough estimate is sufficient.
Conclusion
The stock-to-flow model has been a novel way of examining Bitcoin's early, meteoric rise.
However, it will soon break because it predicts nonstop doubling year after year. Our galaxy prohibits nonstop doubling.
Let's be happy with a 14x return in the 2020s. That would result in a $100,000 BTC price in 2029.
Still, I secretly hope I'm wrong and that the stock-to-flow model is correct.
Epilogue: Why Plan B blocked me on Twitter
When I published this article, I sent Plan B one tweet, asking for his feedback. He said he "stopped reading after Problem #4," thereby ignoring the three most serious problems with the S2F model.
Even though I didn't send him a second tweet, he blocked me on Twitter with this explanation:
Blocked
— PlanB (@100trillionUSD) May 4, 2020
Reason: pure click-bait ("flaw" "fail" "doomed", only old and debunked arguments)
Plan B blocked anyone who told him that he was wrong to block me.
The drama was covered in Bitcoin.com.
Although I disagree with Plan B's S2F prediction, I respect him as an analyst. Here are the three reasons why I'm disappointed with his reaction:
-
Plan B believes his eye-popping $288,000 prediction is somehow not clickbait, but critiquing it is.
-
"Debunked" means that an argument has been proven false. However, as of May 4, 2020, no claims have been proven false. We're both debating something that hasn't happened yet. We must wait up to 10 years to determine whether Plan B debunks my arguments or I debunk his. I sincerely hope that he debunks my arguments! I've never wanted to be so wrong in my life!
- I could understand blocking if someone is harassing you, being offensive, or impolite. However, blocking to avoid a legitimate debate is immature, close-minded, and insecure. It's another sad example of people wanting to live in their echo chamber.
So who's right?
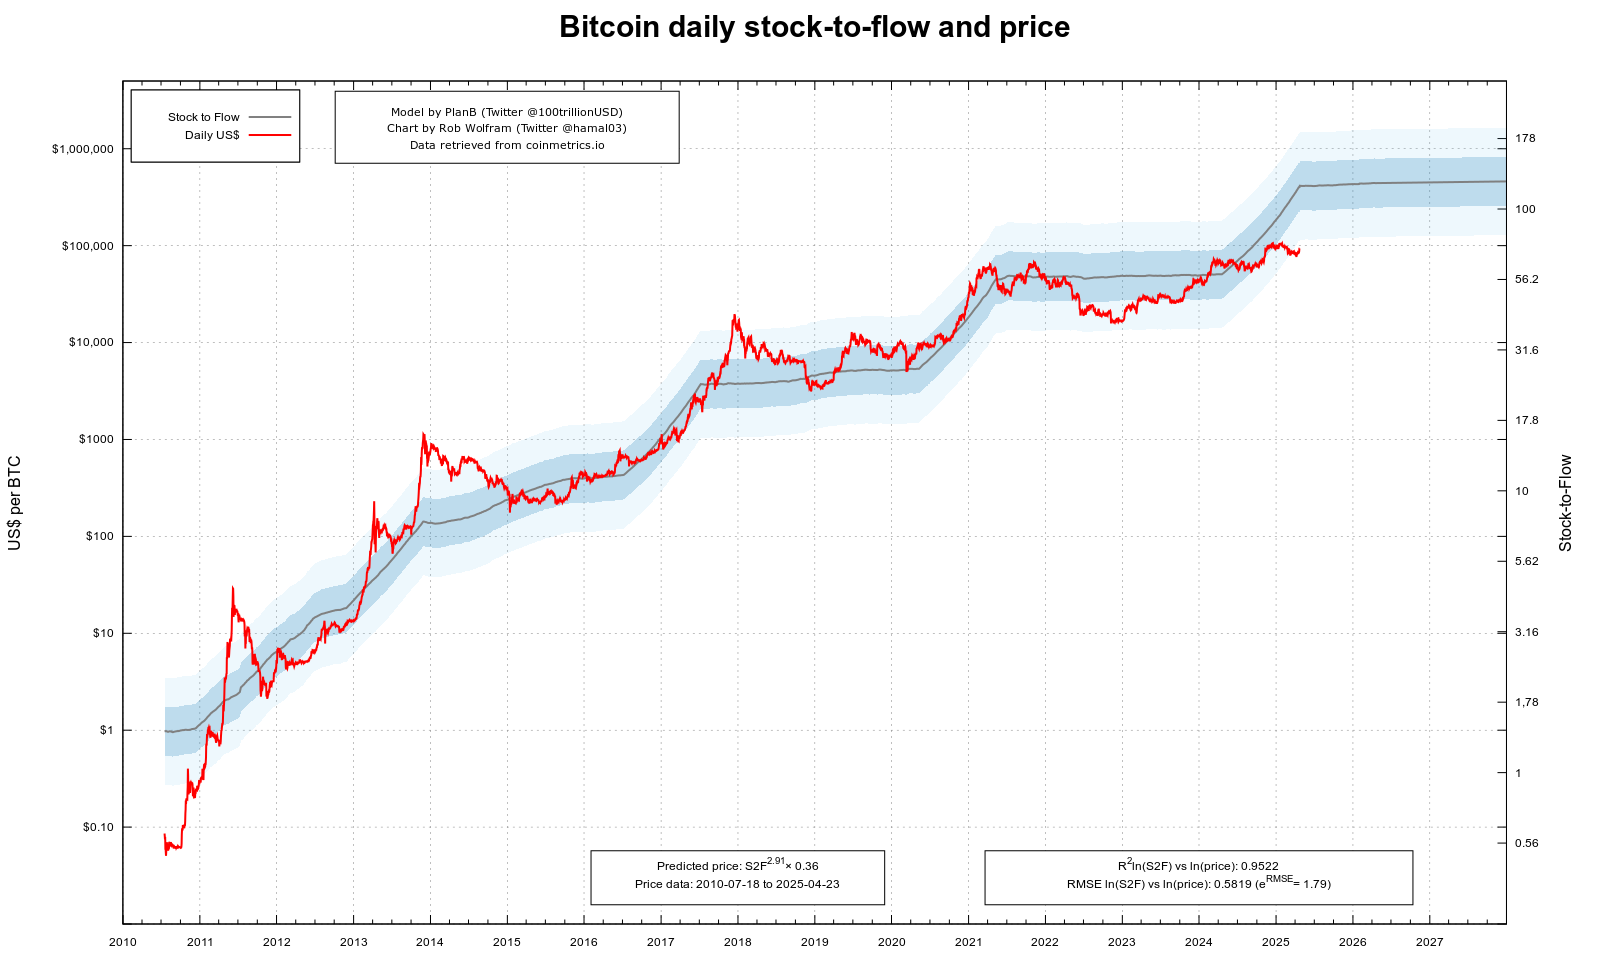
Plan B claimed that he's already "debunked" all my arguments. However, only evidence can debunk a hypothesis. That evidence will begin to trickle in over the next few years after the May 2020 Halving.
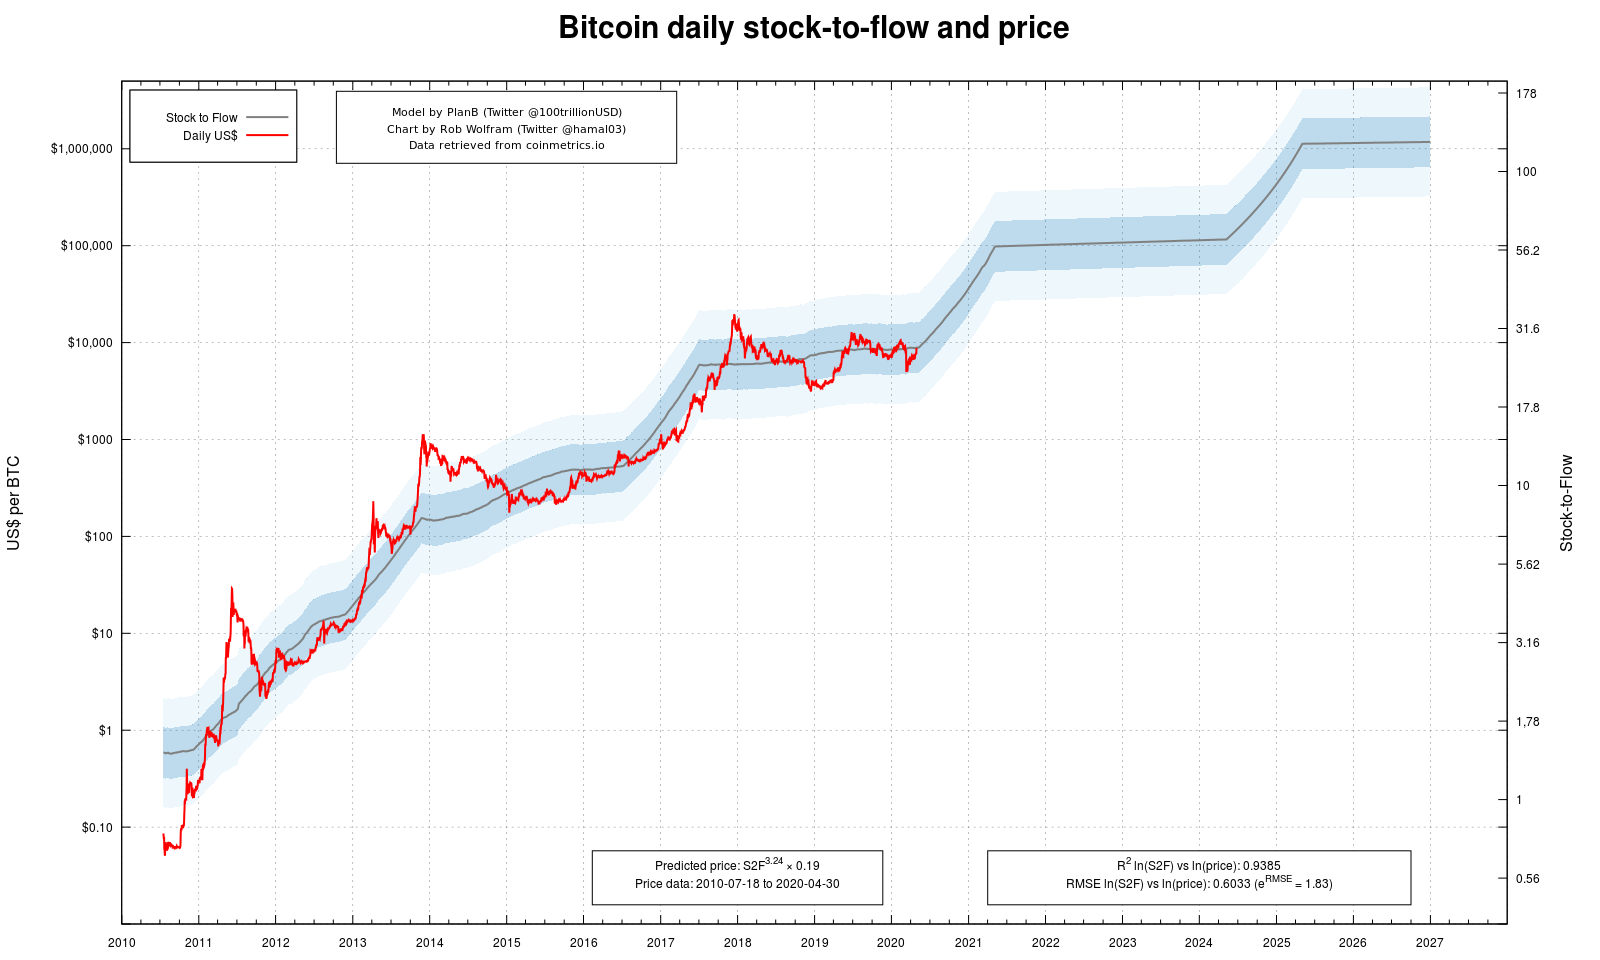
To see if BTC's price is keeping up with the STF prediction, see Rob Wolfram's daily S2F graph below. (If it's not up to date, you may need to click on the graph.)
I'm in a no-lose situation:
- If I'm right, I'll have won the debate.
- If I'm wrong, I'll be rich.
Frankly, I hope I'm wrong!
Subscribe to my WanderLearn podcast!
May 11, 2021 update
Read my reflections on this article, exactly one year after I wrote it. Or watch the video below:
May 9, 2022 update
Read my 2022 analysis at the halfway point of the bitcoin halving. Or watch this video:
May 2023 update
May 2024 update
July 2025 update
Coming soon
Additional information
Read all 3 of Plan B's articles.
Jan Nieuwenhuijs, a gold researcher and early bitcoin adopter, discussed bitcoin's stock-to-flow in my interview with him:
Thanks to the Gold Broker for several of these graphs.
Here is a more quantitative critique of the stock-to-flow model.
And here's a mathematical dismantling of the S2F model.
If you like this podcast/video, subscribe and share!
On social media, my username is always ftapon. Follow me on:
- http://facebook.com/ftapon
- http://twitter.com/ftapon
- http://youtube.com/user/ftapon
- http://pinterest.com/ftapon
- http://tumblr.com/ftapon
My Patrons sponsored this show!
Claim your monthly reward by becoming a patron at http://Patreon.com/FTapon
Rewards start at just $2/month!
If you prefer to make a one-time contribution, you can send it to my PayPal at
If you prefer giving me Bitcoin, then please send BTC to my tip jar: 3EiSBC2bv2bYtYEXAKTkgqZohjF27DGjnV
Correction: I originally stated that Plan B's stock-to-flow model predicted an average price of $55,000 in 2020. That was somewhat wrong since Plan B said it would hit that price point in 2020 or 2021. I have updated the article to reflect that.
What do you think of the stock-to-flow model? Leave a comment below.